Feb 11, 2024
Introduction
This is my first article in the series of Understanding the essentials. The reason I am starting this series is to practice and improve the concepts that I am learning in Machine Learning and Data Science.
Over the Series, I will be using a lot of frameworks, code and software which I will list at the end. For example, for this article, I made a draft in Overleaf, as I wanted to learn it for my Capstone project. I then went on to look for Datasets on Kaggle which fit the topic and implemented a notebook. After that I put everything on GitHub to document the process and published it on Medium.
Moving on to explaining the topic.
Regression Explained
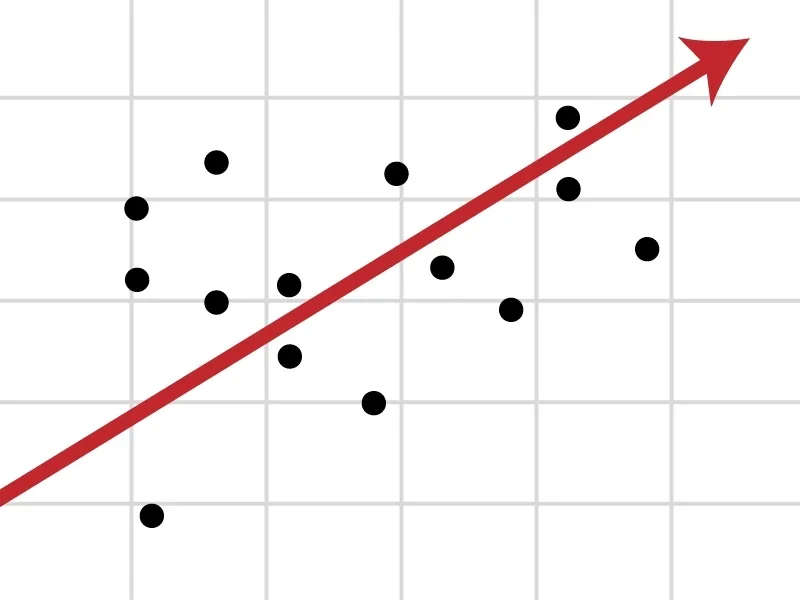
Regression is a statistical method used to understand the relationship between dependent (target) and independent (predictor) variables. It is primarily used for prediction and forecasting, where one variable is predicted based on the information available from other variables.
To give you a better understanding of independent and dependent variable:
Independent Variables
Independent Variables are also known as predictor or explanatory variables. These are variables that are manipulated or selected by the researcher or me in this article to investigate their effect on the dependent variable. They are considered the cause or input in an experiment or model. Some characteristics for them are:-
They are assumed to be the cause of changes in the dependent variable.
In a study or model, these variables can be controlled or changed to observe how they affect the outcome.
Independent variables are plotted on the x-axis in graphical representations.
Dependent Variables
Dependent Variables are also known as response or outcome variables. These are the ones that are being tested or measured in a model. They are considered the effect or output that occurs as a result of changes in the independent variables.
Note:
They can be viewed as cause and effect. If the Independent variables are changed, then an effect is seen in the dependent variable.
To get a clearer picture
Dataset
We will be using a dataset for this article called — Data for Admission in University. Pretty straight forward. It can be found here.
Since we learned about Dependent and Independent variables, we can classify the variables from the dataset as follows: —
Independent Variables from the data:
GRE score — Continuous Variable, ranging up to 340
TOEFL score — Continuous Variable, ranging up to 120
University rating — Categorical Variable, rated from 1 to 5
SOP (Statement of Purpose) — Continuous or Ordinal, rated from 1 to 5
LOR (Letter of Recommendation) — Continuous or Ordinal, rated from 1 to 5
Undergrad GPA — Continuous variable, scaled up to 10
Research Experience — Binary Variable, represented as 0 (no experience) or 1 (has experience)
Dependent Variables from the data:
Chance of Admit — Continuous Variable, ranging from 0 to 1, representing the probability of Admission
Let’s look at the data
Initial impression looks like this: —
If you want to follow the code along, the link to that notebook is here.
Just by looking at this, we can draw out some insights:
all the columns are numeric
We can drop the column “Serial No.” as the values are just unique identifiers and will not help out model
To understand the correlation between the variables we can do lots of things, but a heatmap will be apt in this situation :
This tells us what parameters are affecting our dependent variable the most and if it will help in building our model.
We can see that CGPA is highly correlated with Chance of Admit where as research is the least correlated.
Linear Regression Explained
Linear Regression(LR) is a predictive modeling technique used to understand the relationship between a dependent variable and one or more independent variables.
We can use LR to predict the “Chance of Admit” based on the independent variables. This approach treats the chance of admit as a continuous outcome that can be predicted by the applicant’s profile, exam scores and experience. The LR model will help us in understanding how each variable contributes to the chance of admission and which have the most impact.
Data Science Pipeline
The step by step process before we get to model training is as follows:-
Start by Importing Libraries
Do a bit of Exploratory Data Analysis
Select the dependent and independent variables
Split the data
Initialize and fit the model
Predict, Evaluate and plot the model
The output looks like this: —
Logistic Regression Explained
If we want to categorize the outcome (For example — Admitted vs not admitted), we could convert the “Chance to admit” into a binary variable (For example — 0 if the chance is below a certain threshold like 0.5, and 1 if above). Then, use logistic regression to predict admission status based on the same set of independent variables.
In python, it would look something like this : —
Rest of the process is similar to Linear regression with a few syntax changes, shown in the notebook!
Software Used
Overleaf — It’s an online Latex editor. I was tired of using word and wanted to try something new and wasn’t disappointed.
Kaggle — It’s world’s largest data science community with a lot of datasets. It has competitions and forums as well.
Conclusion
Both models provide valuable insights: the linear regression model quantifies the relationship between each predictor and the chance of admit, while the logistic regression model categorizes applicants into admitted or not based on their profile.
These analyses can help in understanding what factors are most important for admission and how changes in these factors affect the probability of being admitted. I hope you enjoyed this article. Follow for more and keep checking back for interesting stuff.
This concludes our article. If you have any doubts about the concepts, please feel free to reach out to me! Thank you!